← All Antenna examples
ANTENNA FDTD STUDIO · APPLICATION EXAMPLE

Phased Array · OAM Mode 2

A circular phased array with OAM order m = 2, from its target-phase map to the modeled patch geometry and recorded results. Explore the supplied Phased arrays example in Antenna FDTD Studio.

01 · SYNTHESIS & MODEL

From OAM phase map to patch array.
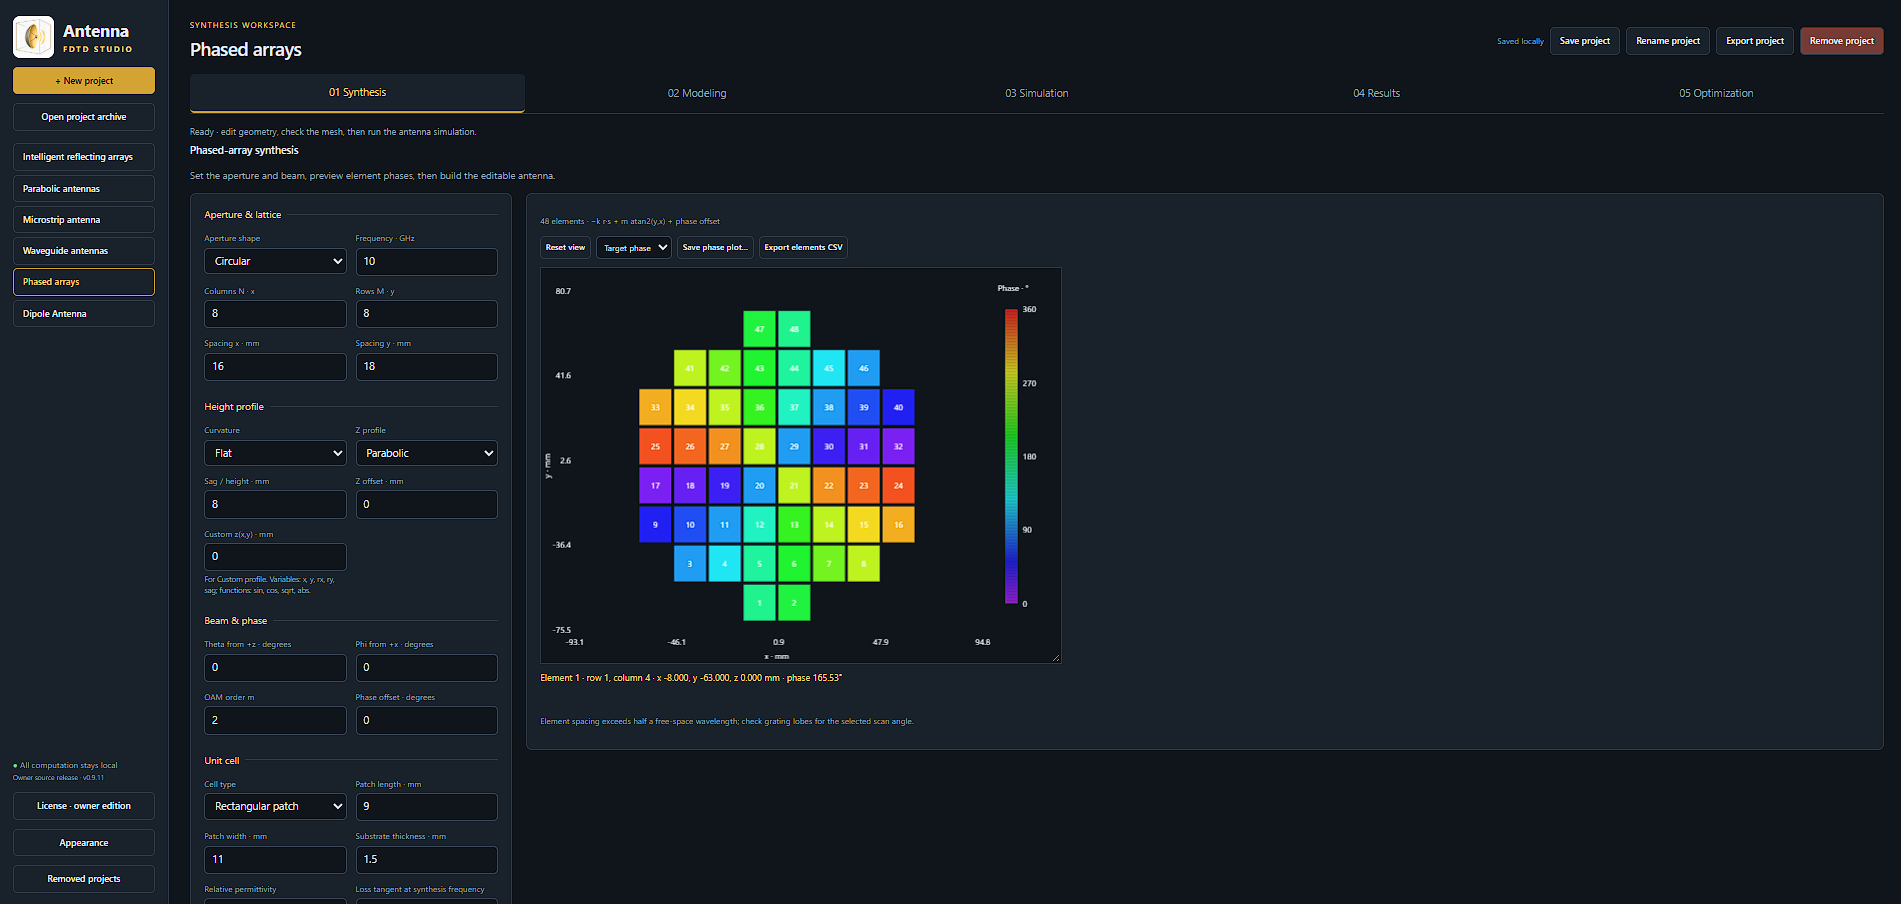
The supplied synthesis workspace shows a circular 48-element target-phase map, with OAM order m = 2, frequency 10 GHz, and lattice spacing of 16 mm along x and 18 mm along y.
OAM mode 2 synthesisThe supplied synthesis workspace shows a circular 48-element target-phase map, with OAM order m = 2, frequency 10 GHz, and lattice spacing of 16 mm along x and 18 mm along y.
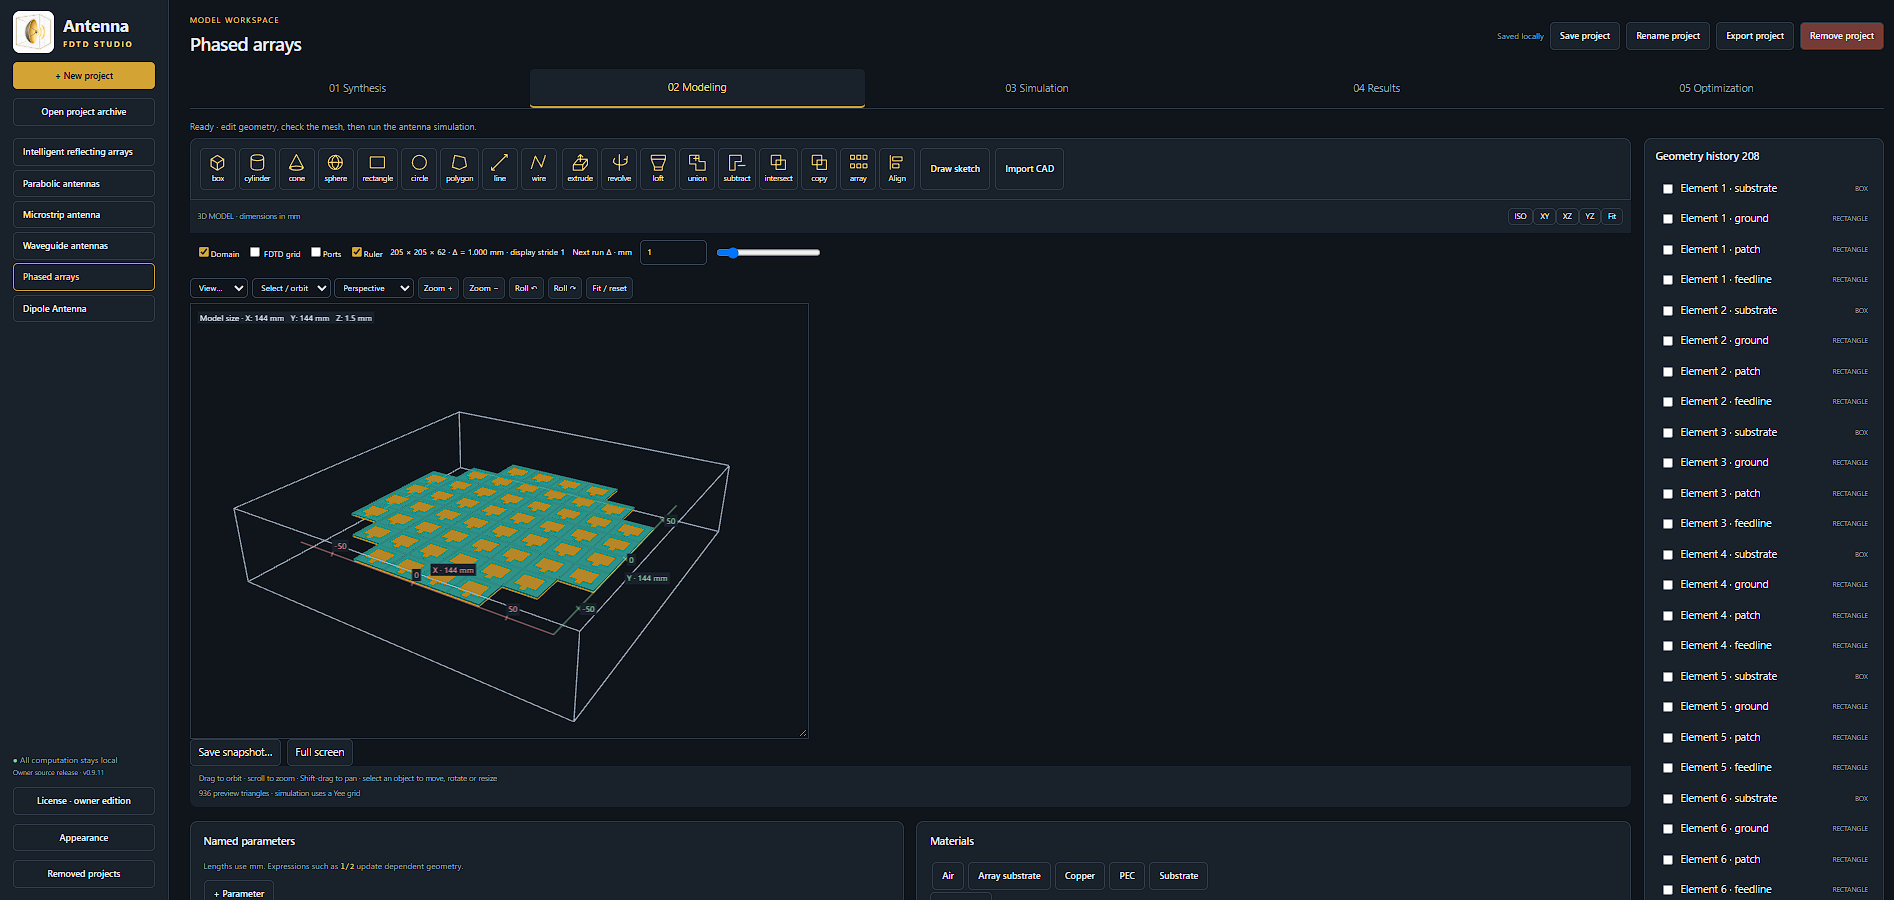
The supplied modeling workspace shows the patch-array geometry, with domain bounds, dimensions and element geometry history intact.
Patch-array modelThe supplied modeling workspace shows the patch-array geometry, with domain bounds, dimensions and element geometry history intact.
02 · RECORDED FIELDS

Follow the recorded array fields.

Recorded electromagnetic-field animation · all 24 exported frames, in their original order and at the original 12 fps playback rate.

03 · RADIATION PATTERNS

Explore the radiated response.
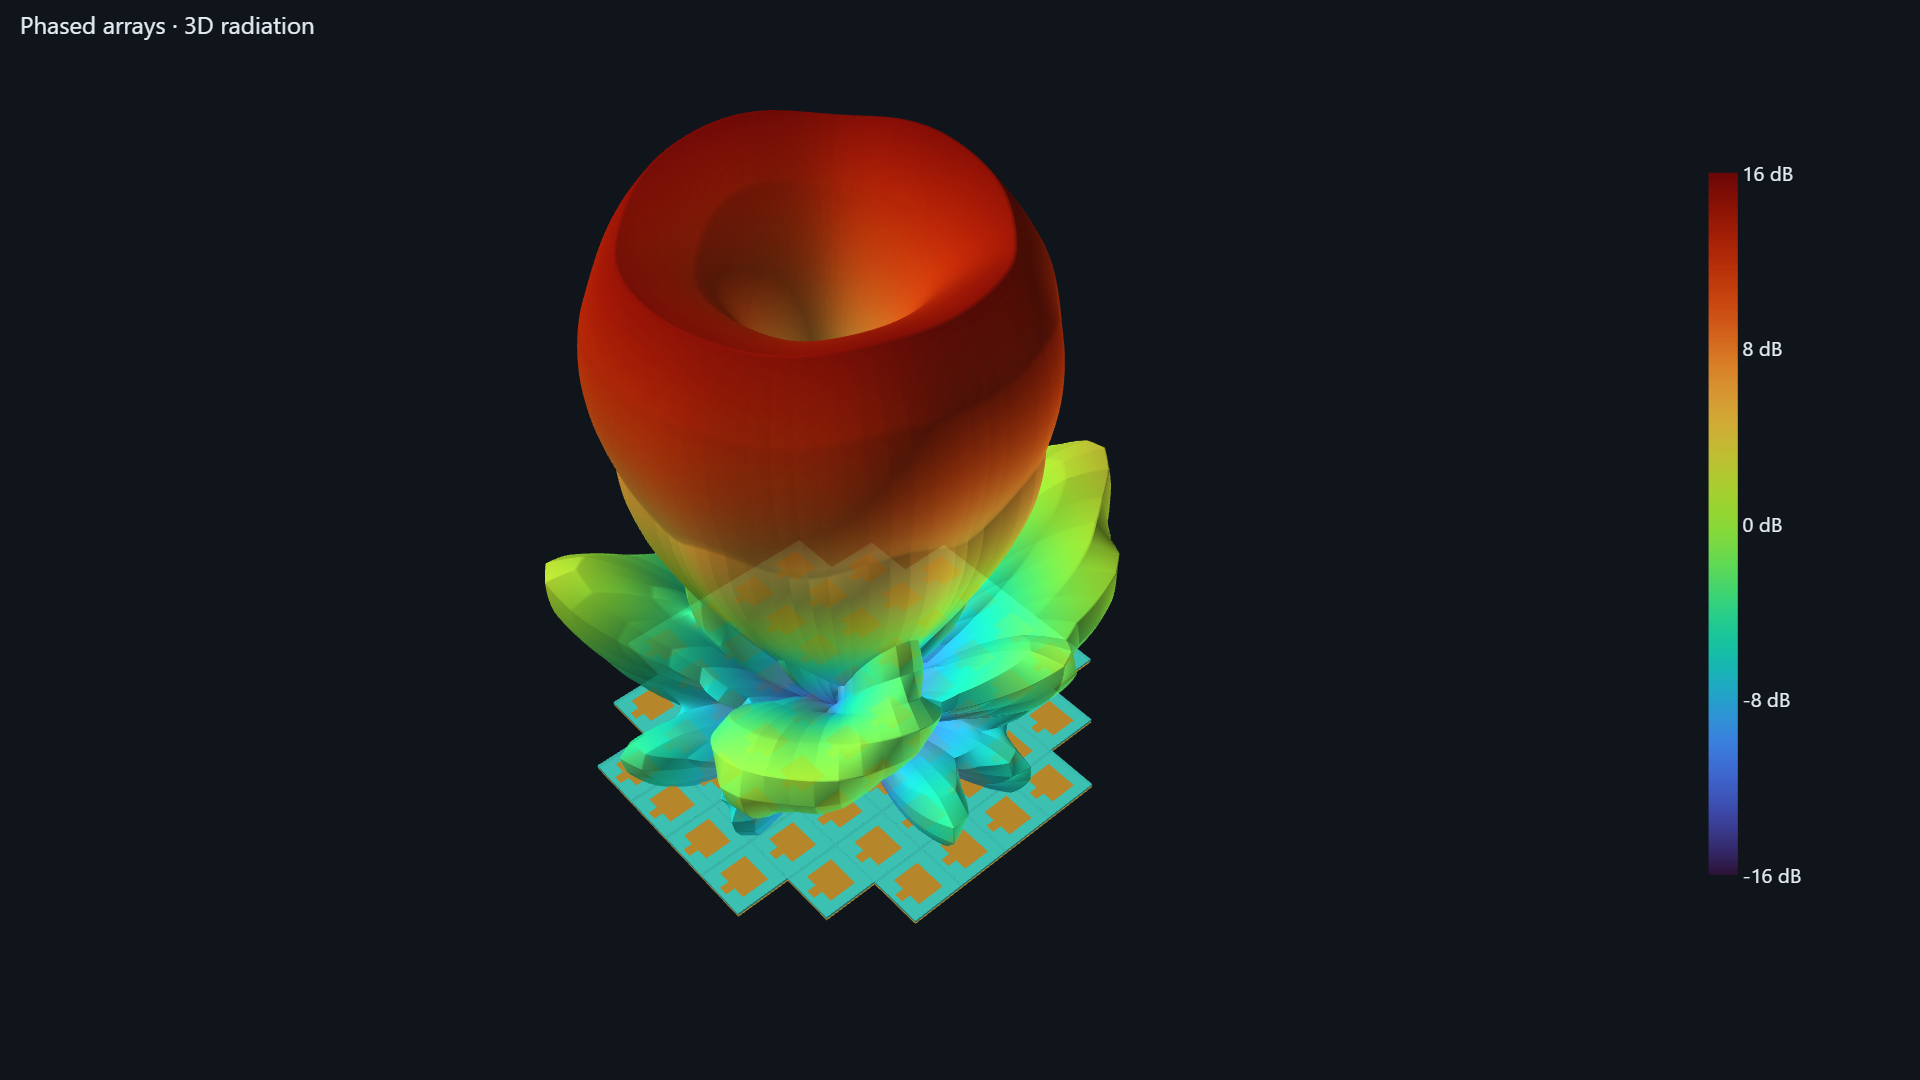
The supplied 3D radiation export, labeled Phased arrays, retains the modeled array and its original −16 to 16 dB color scale.
3D radiation patternThe supplied 3D radiation export, labeled Phased arrays, retains the modeled array and its original −16 to 16 dB color scale.
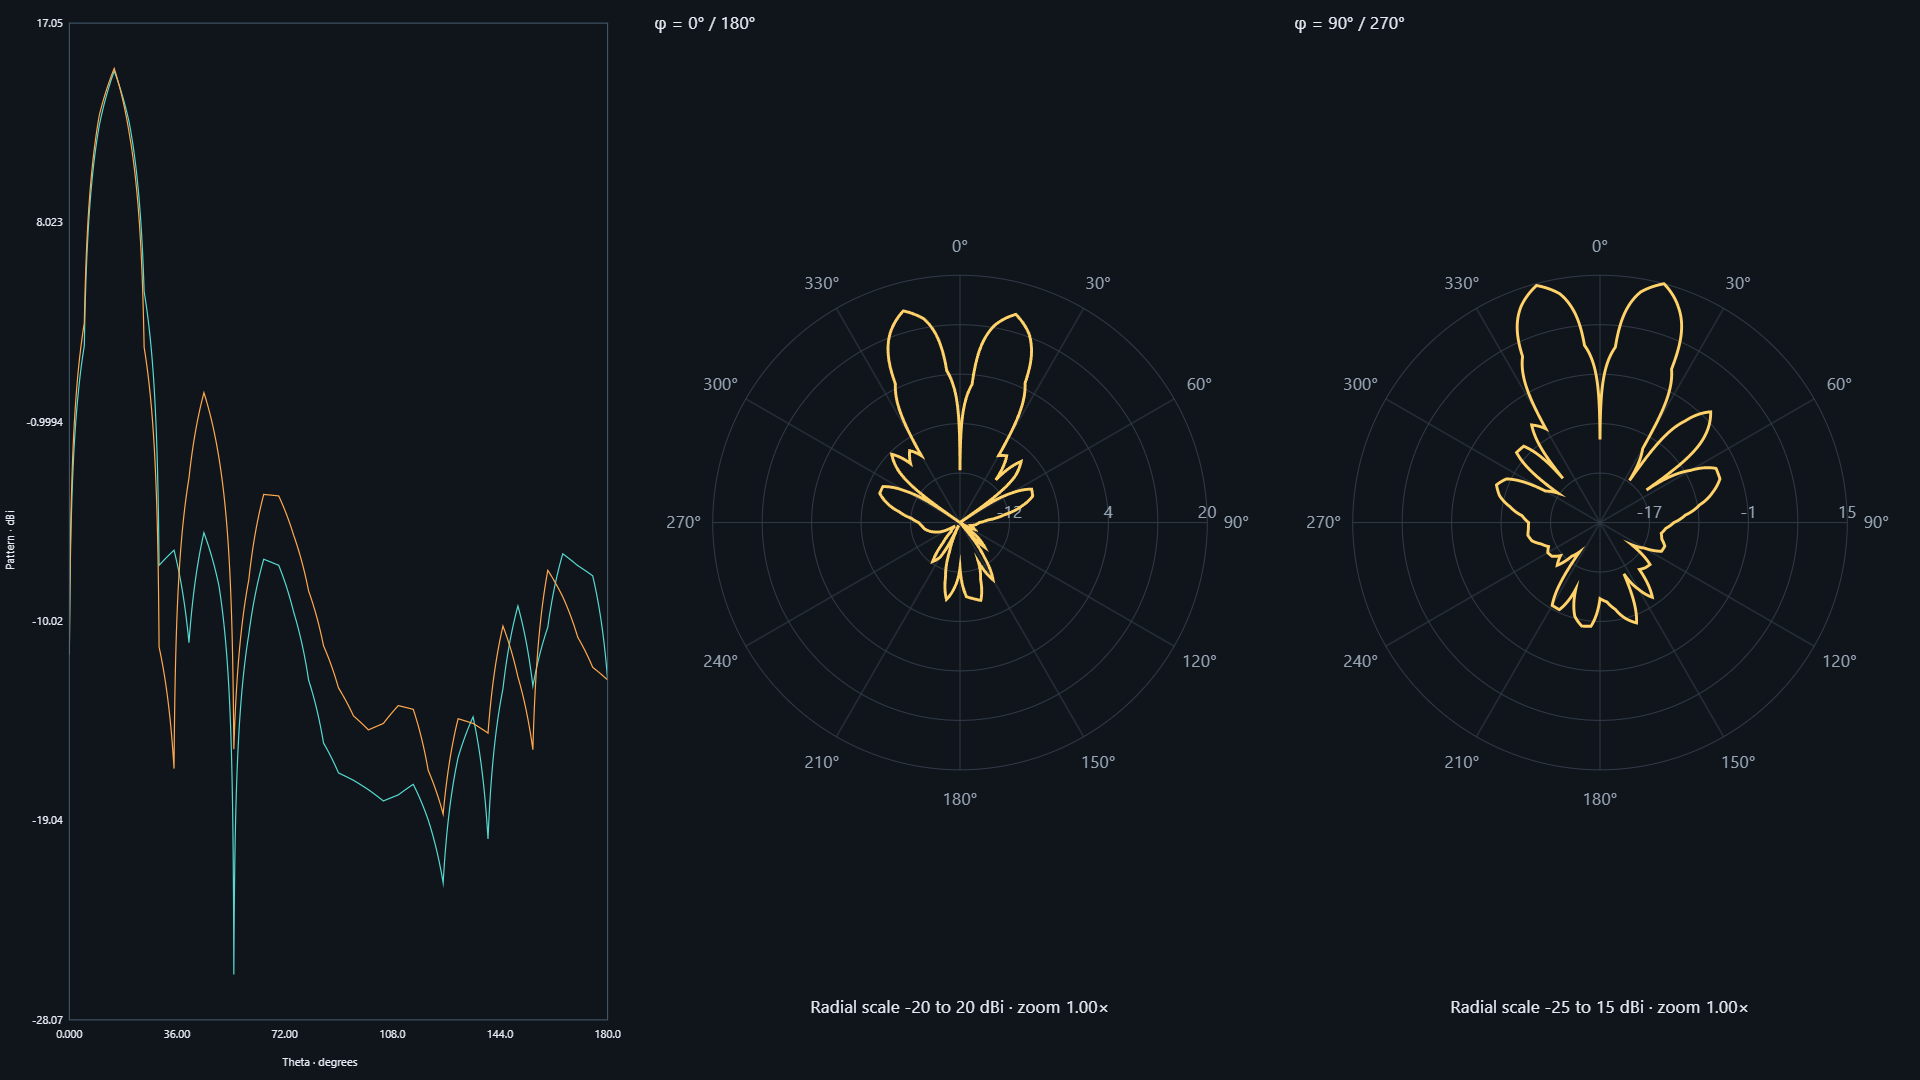
Pattern versus theta, alongside the φ = 0° / 180° and φ = 90° / 270° polar cuts. The original plots retain their respective −20 to 20 dBi and −25 to 15 dBi radial scales.
Radiation cutsPattern versus theta, alongside the φ = 0° / 180° and φ = 90° / 270° polar cuts. The original plots retain their respective −20 to 20 dBi and −25 to 15 dBi radial scales.
04 · PORT RESPONSE

Inspect the original port-response plots.
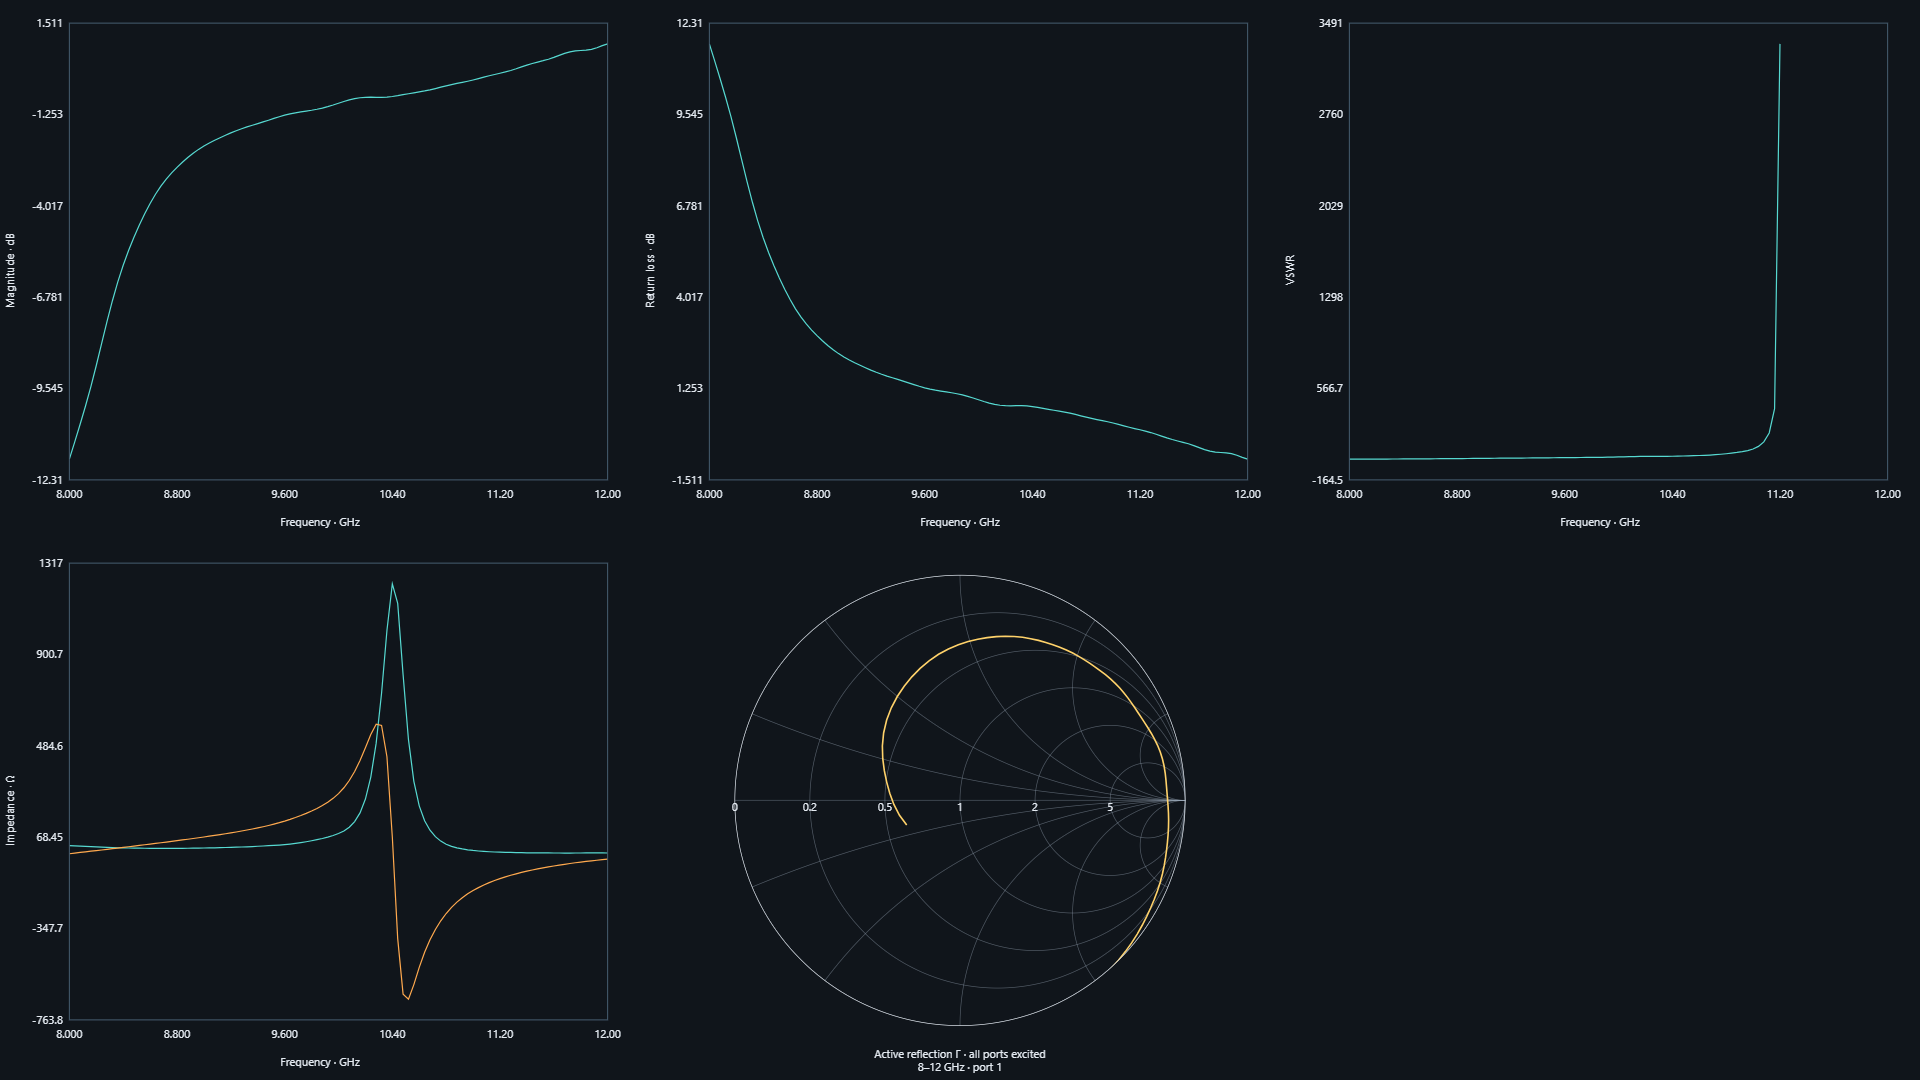
The supplied export contains magnitude, return loss, VSWR and impedance plots, plus a Smith chart labeled active reflection Γ · all ports excited, 8–12 GHz · port 1. All original axes and traces are preserved.
Port-response overview · 8–12 GHzThe supplied export contains magnitude, return loss, VSWR and impedance plots, plus a Smith chart labeled active reflection Γ · all ports excited, 8–12 GHz · port 1. All original axes and traces are preserved.

Images retain the supplied pixels, axes and color scales. OAM mode 2 is identified by the supplied synthesis workspace. The video is a web-playback copy of the supplied animation, preserving its frame count, dimensions and timing. This page presents the recorded material and does not run a solver.

Back to Antenna examples